


Racing, luxury automotive, and aerospace – these are the industries that one of my guests on the podcast today is at home in. More specifically, in this episode Madeleine Mickeleit talks to a manufacturer of mechanical systems in the high-tech sector – a case study straight from the shop floor.
Episode 81 at a glance (and click):
[11:55] Challenges, potentials and status quo – This is what the use case looks like in practice
[18:44] Solutions, offerings and services – A look at the technologies used
[30:43] Results, Business Models and Best Practices – How Success is Measured
Podcast episode summary
The challenge: Production with machines for machining or heat treatment has grown over the years from approximately 15,000 motorcycle transmissions to 160,000 per year. This corresponds to two million individual parts and the number of production managers stayed the same. You can already guess where the journey is headed. Everything that runs manually today will be shuffled around. No more printed lists and flipcharts for shift managers, in which employees have to enter production progress by hand every two hours, and no more reactive target/actual planning; everything will be cast in digital processes, because every minute counts on the shop floor.
Like the industry itself, the associated IoT solution provider is also moving fast. The company “Peakboard” from Baden-Württemberg is an expert for such all-in-one solutions and reports on the project together with its customer “Pankl Racing Systems”.
Podcast interview
Hello Mario and Matthias! Where are you right now?
Matthias
Good day to you! I am currently in my home office. The special thing is that I’m not based in Stuttgart like my colleagues, but in beautiful Würzburg, in the middle of Germany, a very nice wine region!
Certainly worth a visit. Mario, where are you right now?
Mario
Thanks first of all for the invitation. I am currently in Austria in Styria at the beautiful Kapfenberg, in a currently very quiet meeting space.
Do you have a location in Austria or what is the structure like?
Mario
The location is simply one of the plants in Austria where we manufacture transmissions for KTM.
Matthias, you are Head of Service, or Technician Consulting at Peakboard. It’s best to start by introducing yourself in general and explaining what exactly you’re responsible for at Peakboard.
Matthias
My name is Matthias, I work at Peakboard and have been working as Software Consulting since 2018. At that time, we were a small team with a relatively young product. The product has evolved since then, as has the team, and at some point, you need someone to take care of it so that the team does what it’s supposed to do. So, I grew into this role and have been looking after my consulting team since 2021. That means whenever it comes to implementing projects at the client or providing technical support, it goes through my team and me. Ultimately, this led me to Mario.
Peakboard is an all-in-one solution that allows me to link data from various sources in real time. You can visualize a wide variety of data and connect and process key figures from systems. You make the data visible where it is needed, see the shop floor. Can you put it that way? Which customers do you work with here?
Matthias
You described that very well. Basically, you can use Peakboard whenever you have data and you want to provide that data in real time. If you want to create transparency, inform your employees and have this information immediately, Peakboard is an ideal product for this.
As far as customers and industries are concerned, the product is so versatile that you can use it anywhere. It can be a one-man operation, but also a large corporation. Here, the area, whether it’s logistics, whether it’s production, or even beverage production, doesn’t matter.
Can you give us three examples of where you are active with customers? What use cases do you have there?
Matthias
Spontaneously, the Bosch use case comes to mind. It was about a super-automated process in semiconductor production. There are hardly any people working here, but a lot of data and information. The few people who work there have to keep track of all these processes and everything else. To do that, it’s helpful to have an appropriate dashboard where I have my live information to be able to control the automated production.
From the robotics area, the Zarges use case comes to mind. Zarges has manufacturing robots that cost a lot for their standstill; however, they are supposed to be producing, not standing still. Here we have supported production in such a way that we have captured this data and can now see exactly whether the robot is running or whether it is standing still and, above all, how long it is standing still.
You have a joint project with Mario – what exactly is this about?
Matthias
A similar thing as just described – it’s about bringing transparency to production.
If you would like to know more about the project with Bosch or also with Zarges, please feel free to come to our monthly exchanges and discuss with other end users. The most necessary information is linked in the show notes.
For starters, I’d like to know more about your get-together. How did you get together?
Matthias
Mario joined us and we talked about the project in classic presales. Is this something I can do? What can I do? That’s the way we were exchanging ideas at first. After the presentation, I thought that this sounded like a perfect project for Peakboard – we just had to do it, it would be good; I knew that. Initially Mario was skeptical, and at this point it’s best I turn the floor over to him.
Mario
Classically, I used Google to search for a solution for us. In the process, I came across the company Peakboard and made the first contacts. I always ended up with Matthias, who kept telling me that they could do it.
You are the head of automation technology. What are your classic tasks here and what exactly does your company do?
I am Mario Pichler, I have been with the company “Pankl” for 19 years and had the privilege of managing quality assurance here for about 15 years. Everything that has to do with measurement technology was my work here. I was always interested in such digitalization projects, as well as automation in the sense of handling parts. Not to forget automation in processes. Three years ago, I was able to take over automation technology at the Kapfenberg site, Pankl’s newest plant.
Everything that has to do with digitalization, data management and visualization, I have taken up. Automation technology means looking after all automation systems and robot systems.
Why does your company name include “Racing”?
Mario
What we came from was and still is that we are suppliers for racing, luxury cars and also for the aviation industry. We are in almost every race car and almost every race series; all the way to engine components for luxury cars. So we address a niche market.
Does that mean larger customers like Ferrari?
Mario
Exactly; among others, we have Ferrari and Porsche as customers.
What is your vision of digitization? Is that related to your plant?
Mario
I am responsible for our plant as far as these topics are concerned. We wanted to start a pilot project, which addresses the topic. What does that mean for us? Up to now, we have been very rudimentary. We used notes on flipcharts where the employees had to enter progress every two hours so that the shift supervisor could come and see that we were on track and not off track on this machine. So of course, we were not “state of the art”. For a plant that is actually so highly modern, it was not our long-term goal to resort to such solutions. That is why we decided to solve our work transparently, automated and according to the latest technology.
Challenges, potentials and status quo – This is what the use case looks like in practice [11:55]
What plant are we talking about here, what do you produce and with what processes?
Mario
The plant was built at Greenfield in 2016 and the ramp-up started in 2017. We manufacture motorcycle gears; each individual component – meaning the gears and the shafts – have all the machining done in-house. Just the heat treatment and finishing and assemble the individual components into a ready-to-install motorcycle transmission.
We started with 15,000 gearboxes in the first year and are currently producing 160,000 gearboxes per year. 160,000 times the factor 10/11 of in-house production parts. That brings us to just under two million parts per year. One of our customers is KTM. Here we serve both the on-off-road market and the street variants.
A really broad field, with a correspondingly large number of machines.
Mario
There are actually not that many machines. Currently, we should be at about fifty production machines. In the series production area, we have very short cycle times, which are around 25 seconds per part. We are well positioned here. What we lacked was an overview, with such a growing production of parts.
On the processes, can you highlight the potentials and what are the challenges that you have faced?
Mario
Basically: the documentations on the flipcharts were a trigger. What’s the value of me going there every two hours and putting a marker so the shift supervisor can walk by? That simply too late for series production. Every minute counts, which is why we wanted to move in the direction of automation and digitization. The goal was to make the whole thing transparent to every employee in real time, so that people didn’t always have to meet at the slip of paper, but could view the data from anywhere.
What does growing production mean, or rather what are the requirements here?
Mario
It means looking after more and more plants, with the same number of shift workers. With such a large hall, it’s easy to lose track. Constantly running from one end to the other to see if everything is running becomes more and more difficult.
Can you give some examples of what is written on such a flipchart nowadays and what kind of data is being used here?
Mario
Fortunately, we don’t have the flipcharts anymore. Basically, it’s production data. How many pieces were produced on which machine, by which operation at the current time? Just the calculations behind it – does it correspond to the planned progress or not? We know the exact cycle times for each part, so we can calculate at any time whether we are on target. Accordingly, we can also react more quickly.
You probably have the planning data in your ERP system, right?
Mario
That’s right, but in an ERP system it doesn’t say how much will be finished at 11:40 a.m. at this plant. We had to calculate that with Peakboard.
What has been important for you from the beginning?
Mario
For my company, it was very important not to be dependent on various departments, i.e. not to be dependent on ERP, IoT or other designers, and to be able to react and adapt quickly to changes, precisely to the demands of the end user. A high flexibility of the solution, expandability, little support, in other words, a self-runner; that was the goal and that’s what we found.
Solutions, offerings and services – A look at the technologies used [18:44]
Matthias, can you explain what your joint solution looks like?
Matthias
In the meantime, it doesn’t look the same as it did when we started. You plan something, then you put it into operation and then feedback comes and you realize that it doesn’t work the way it was planned; that happens quite often.
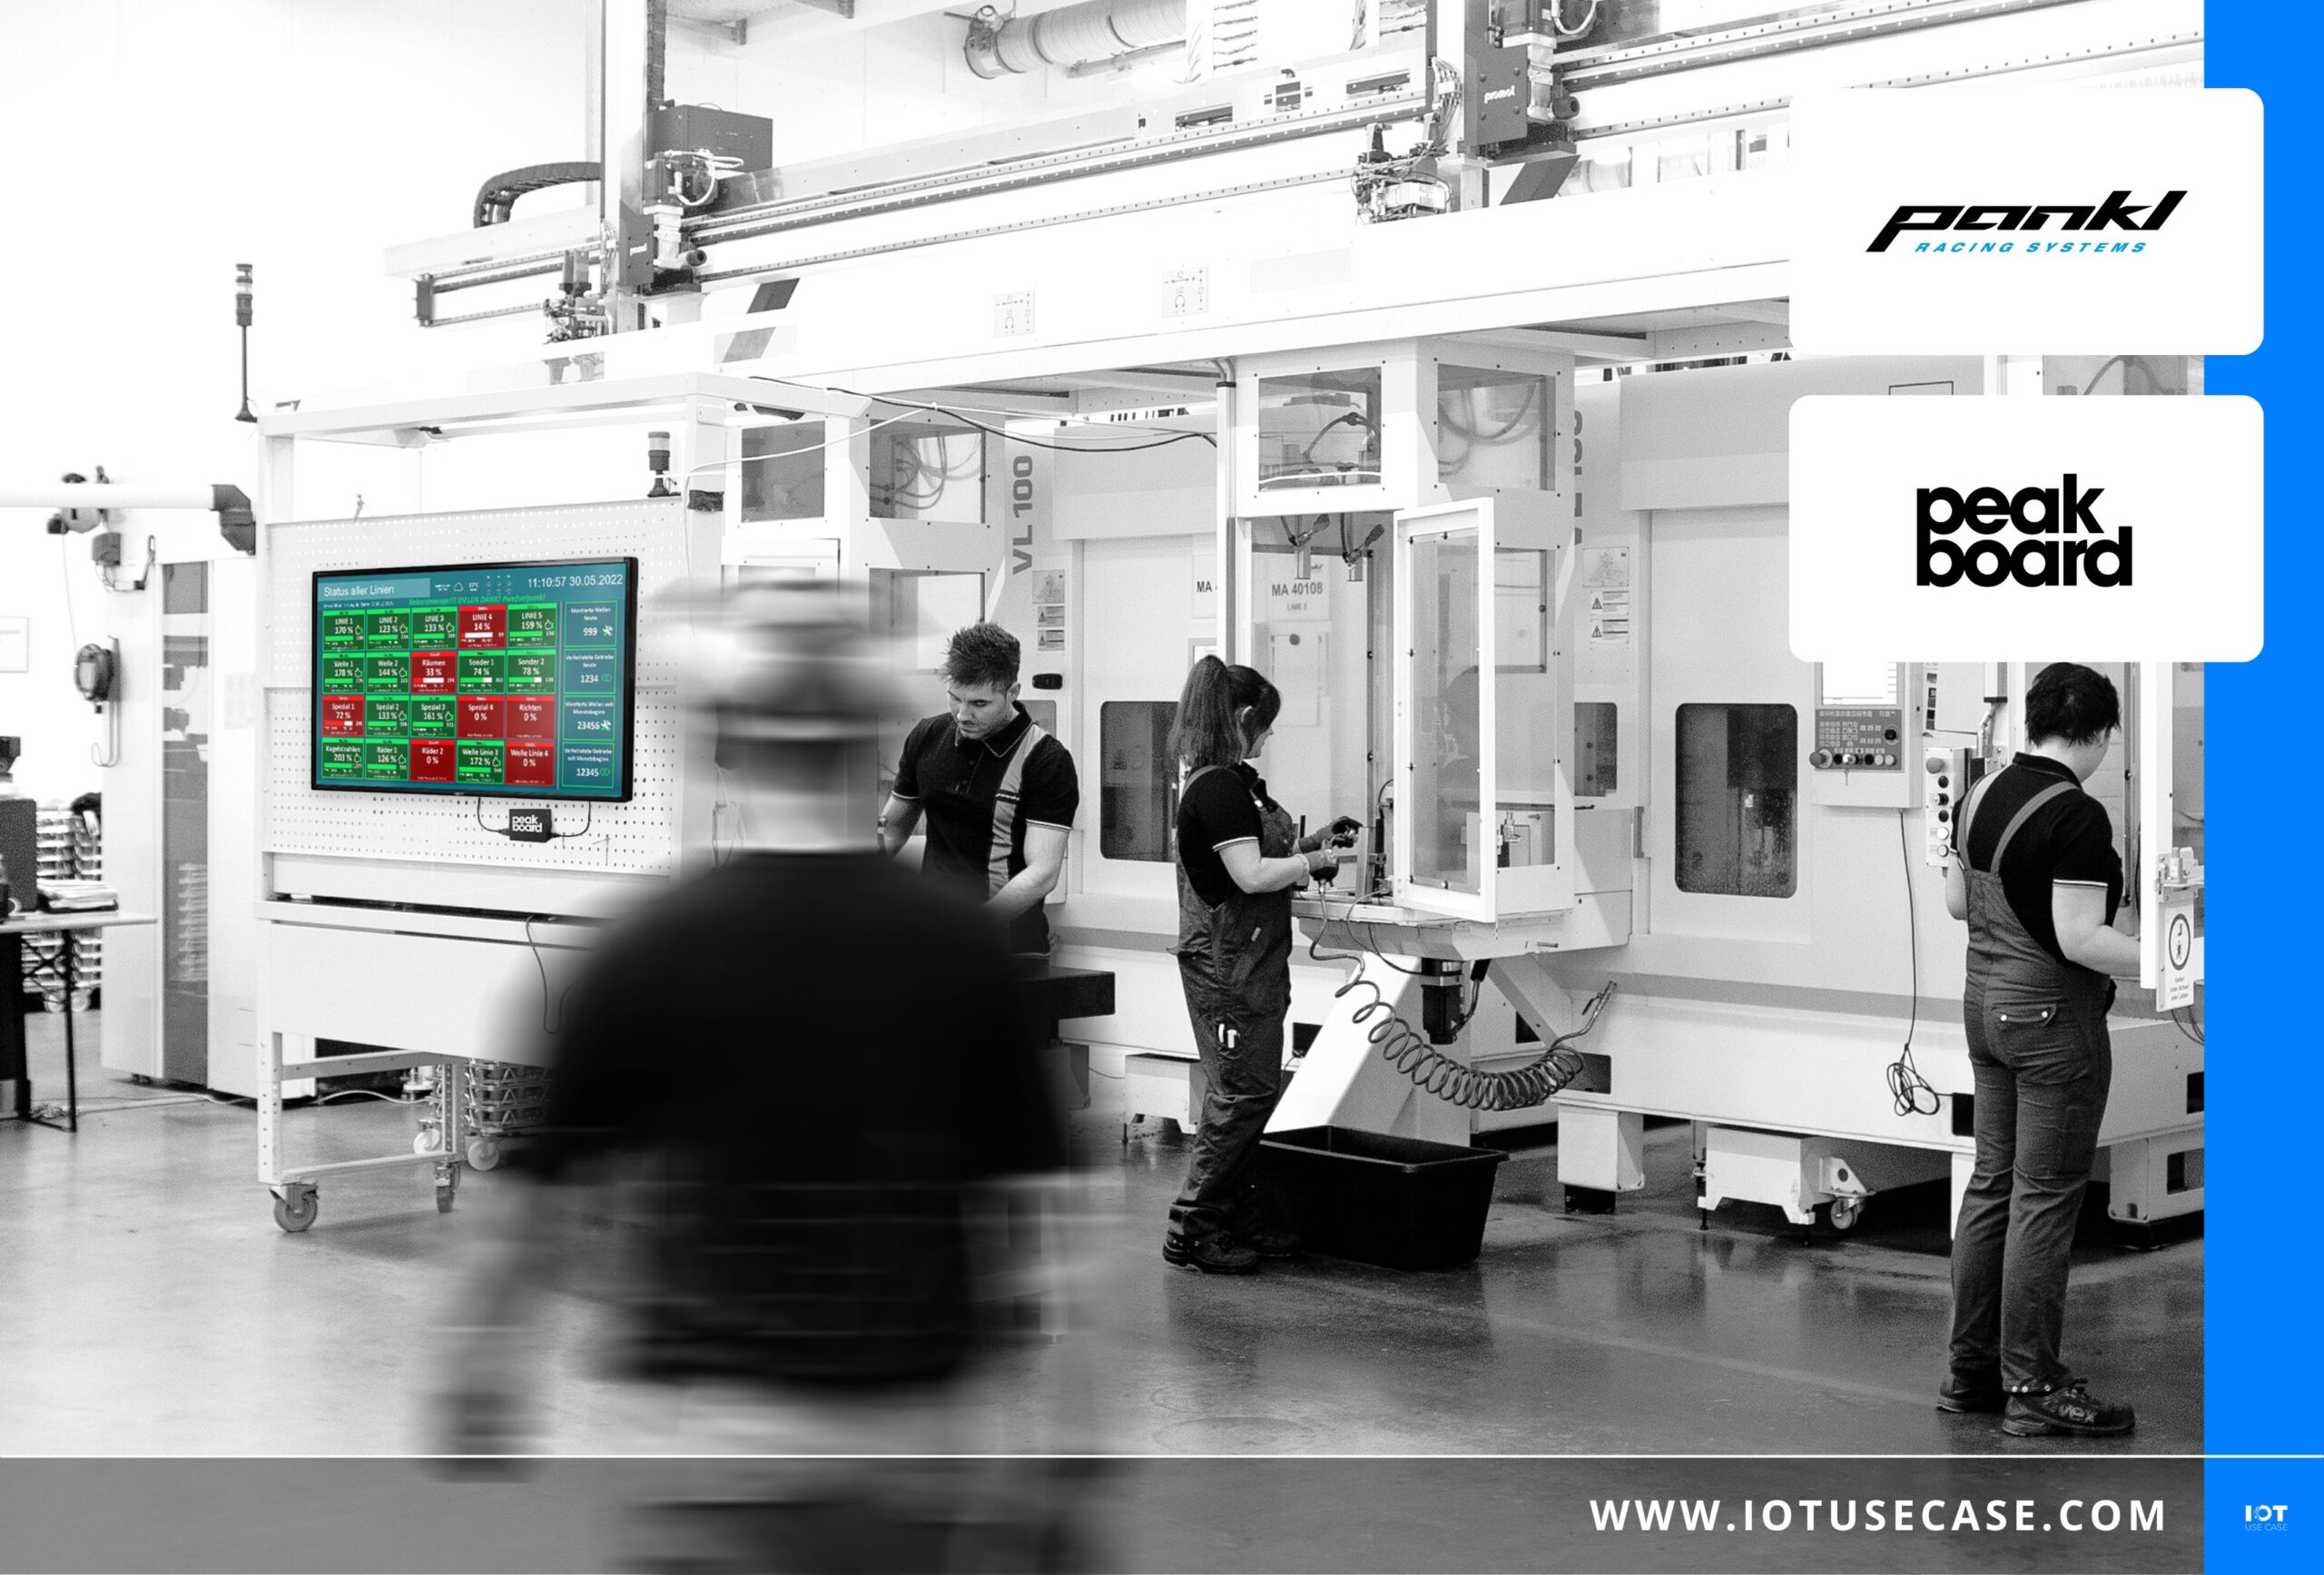
To put that into facts and figures: We did the first draft in almost two days, it ran for two months, and already Mario came and said we need to make adjustments here. Then we consulted together in another 1.5 days and adjusted it. Since then it runs unchanged. You can imagine it as a tile display in which you can see how your current production progress looks. In addition, there is a color display that tells you whether the corresponding machine is running.
If my production is over 100%, then I get a thumbs up as motivation for the employees.
How does data recording work? I have already heard that this involves documentation of the machines, which are digitized, but also hours-per-plant calculations.
Mario
We had a good database. We record every part, on every machine, on every operation, because at the part level we track the whole thing, because each part has a unique serial number. We already had that “lying around” for us, and they had to become analyzable. That is, they were distributed in a database from an ERP system and then it came out in the project that this data had to be tapped. In addition, there is certain individual data, for example, what the order number is, what the individual time of this part would be on the respective machine.
This is all in the system. This was then worked out by our ERP system so that this data is exported quickly, as it is a guideline that third-party systems are not allowed to access the ERP database directly. So a database was created for Peakboard where that data is exported every ten minutes.
We are now talking about 55,000 entries in about 24 hours – and the trend is rising. To handle the whole thing together was the goal.
For such a large amount of data, a good database is immensely important. Matthias, how does it look like in the following? I have the various data from the ERP, how does that work in Peakboard?
Matthias
We first look at what kind of system we have, or rather, what interfaces are provided to us by the system? Do we have any standard ways to access it? Is it maybe an SQL database that we can access, or is it maybe a REST interface that we can use to access data. For that, we have a bunch of interfaces that we can use directly.
Let’s look at it from the SQL level as an example for this. We establish a connection to the database and using a classic SQL statement, we load the data. Once we have the data in Peakboard, we don’t care where the data comes from. This can be Excel data or also machine data, it doesn’t matter, because they are treated the same. For this I don’t have to master complex script languages, but simply do it – in our case – via “dataflows”. With that, you can just “click” things together. If this is not enough for me and I want to write it more complex in a script, then we have a “Buildings Block Mode”, where I can write myself in a kind of puzzle system, program codes.
So I don’t need any programming skills, but I can use Buildings Blocks to pull together the data and access the interfaces that are already preconfigured?
Matthias
Exactly, but you still need a certain understanding of logic.
Hardware-wise, nothing comes from you, because in that case Mario pulled the systems from the ERP. But if I need hardware, do you have services for it?
Matthias
That always depends on the use case and the definition of hardware. Our product consists of the software on the one hand and the hardware solution, which is the hardware that is responsible for displaying the data on the monitor in real time. We also have another component called “Peakboard Hub”, which strictly speaking is also a hardware. That’s a server installation that brings its own database.
That I would need a middleware connector or something like that, we don’t need that. In rare cases, you need a hardware to get data from machines – a retro-fit approach. For that, we would still have the “Peakboard Edge,” which allows you to form a light barrier or connect a sensor.
Retro-fit issues weren’t a big issue with you, were they Mario?
Mario
No, that wasn’t relevant for us. I’d like to come back to something. For Matthias, it’s like part of his daily bread, but how Peakboard works – basically, anyone can download Peakboard Designer for free and have full functionality on his computer. He can test and program everything. You have a preview in which you can see how my programming would run, to test the whole thing. The hardware that we have very much sourced are the Peakboard boxes; these are single-board PCs that are classically attached to a TV and the network. And these run the whole thing. They are integrated into our network, are managed via the Peakboard Designer or the Hub, and I play our Main Screen, for example, onto the box, and from then on the box works independently and performs the calculations and downloads the data in cycles.
The Main Screen would be the equivalent of your former flipchart, right?
Mario
Exactly, currently we have the Main Screen, which shows all the machines and three more sub-screens, which are in the respective production sections, where only the machines of the respective section are shown.
In the first step you can look at the themes in the designer and test that so I would just link to that.
What you still want to do is the evaluation. Do I do that in the designer as well? Where is the interface between what you have and what is going on in Peakboard?
Mario
Those calculations run in the designer. We get this raw data that we just have to polish. I’m not loading 55,000 rows, I’m running against it with an SQL statement that I get everything per layer. Then I have all the possibilities in the designer. Via the dataflow, you say the current time, how far my shift progress is, my current cycle time and everything that goes with it. I contrast what I should have made with what I actually made, and I have target values from planning – I’m talking about the color display – so you have so many possibilities at that point that a podcast almost wouldn’t be enough.
In the peakboard box, all the data comes in, this raw data is then processed and run into the designer, where you can fall back on existing structures.
Matthias
This is exactly how it works. Im Dataflow hat man die Möglichkeit alles miteinander zu verrechnen.In Dataflow, you have the ability to net everything together.
Results, Business Models and Best Practices – How Success is Measured [30:43]
What does the outcome look like to you guys? You guys have as of now build a solution, which may be expanded.
Mario
After the first workshop, we left with a “monster.” The thing has 35 pages, where every few seconds the displays switch. Matthias had already pointed out to us that this should rather not be done, but we simply wanted to try it out and went to the shop floor with it and waited for the feedback of the employees, which was mixed. The employee sometimes had to wait until he saw his machine, and there was occasionally additional data on it that was not really relevant for the here and now on the shop floor.
Because this software is so easy to use, we sat down again and reworked it. Again, Peakboard supported us perfectly with a UX designer who told us how to best combine the colors. The whole thing took another day and regulated on a fixed screen, with the most important information.
It has become, from my point of view, a beautiful andon board with all the necessary information. The feedback is also consistently positive. Expansion in the sense of “more machines” is also quite simple. We already structured the whole thing at that time so that we can add machines very easily, so we can prepare well.
By “monster” do you mean data architecture?
Mario
Monster in the sense of overloaded with irrelevant data for the employee on the shop floor. This Peakboard can also be scrolled through. There were 28 pages there that were scrolled through and the employee might have to wait for his machine to come. Here Matthias was right – less is more.
This is also a good best practice that you can pass on to others who are implementing similar projects. Do you have any other learnings?
Mario
I would say to get the end users on board earlier, because just because I like it doesn’t mean that the employees will like it as well. So, in the end you can still gain experience.
I think it’s very good that you work so closely with the individual departments. That means that you don’t just show colorful slides, but also do a lot.
Matthias
For me it was a very nice project and I also enjoyed it a lot. I learned a lot about the transmission and product spectrum. You never really thought about such things before.
I also like to ride motorcycles myself, but where you have the individual parts manufactured, you often do not know, so I can only agree!
What else can we look forward to in the future?
Mario
We are currently expanding with Edge Boxes, which are Ethernet-based IO boxes where we are currently starting to query the status of robots at our plant and display it in real time on the dashboard. We have already installed the first box here. Because we have an internal employee magazine in which we have publicized this topic, there have already been requests from other plants for support. We are also in the middle of this at another of our plants in series production, where we have also implemented this in a similar way to ours, with data from the ERP system. In addition, we currently query the machine status in real time, which we in turn display on a dashboard.
It remains exciting and Peakboard always offers new functionalities.
Maybe this podcast will be used internally with you guys to share how you or others do it too.
Thank you very much for the elaboration of both of you! Everything else can also be done offline with you..
Matthias
Absolutely; thanks for having me!
Mario
It was a pleasure for me as well. Take care!