azeti brings a lot to the table when it comes to IoT. With our software platform, we help industrial customers gain access to all relevant data generated in production and use it for all kinds of industrial use cases. This creates a higher level of transparency and enables our customers to achieve cost efficiency, greater resilience and overall sustainability in production.
When we talk about your production site: Which departments do you work for here? Who is involved there?
Yanni
Within Aurubis, we work with different teams. We have the local automation teams that select the right equipment and sensors to measure the process parameters. Then we have the local maintenance team that places the equipment. And the operating technology team is responsible for data acquisition and monitoring in the industrial network.
Florian, you have the “IoT hat” on. Do you work with the different teams on these digitization projects, including the operations team and all the others?
Florian
Yes, because the implementation of the use cases we are doing in this project requires different skills. The core project team works with various departments, including Production, Maintenance, as well as Data Science and Corporate IT. The project team’s tasks range from identifying the problem to developing and executing a plan to actually address the issues. That means they work on things like connecting relevant shopfloor systems and analyzing data from machines and control systems and sensors. This extends to designing dashboards and implementing machine learning models.
We use agile methods here and also continuously incorporate feedback from our stakeholders to ensure that we are on the right track. And all this together ensures smooth cooperation between these people. This is essential for the successful implementation of use cases, which in turn form the basis for a Digital Factory, as the project we are carrying out at Aurubis is called.
I now understand what your daily work looks like. Now I would like to come to the challenges. Florian, you just mentioned some difficulties you’re noticing and some potentials. What are the challenges, Yanni, that you encounter here with this different kind of manufacturing process?
Yanni
With multiple production lines running around the clock for long periods of time, it’s not always easy to plan for production downtime – especially when there are unforeseen production stoppages. We want to improve on this point.
As you mentioned, it’s different things like temperature or pressure, and you have these shutdowns. And for that, you really need the data. Maybe we can talk a little bit about these different data points that are relevant. What kind of data are you most interested in? Do you have some examples?
Yanni
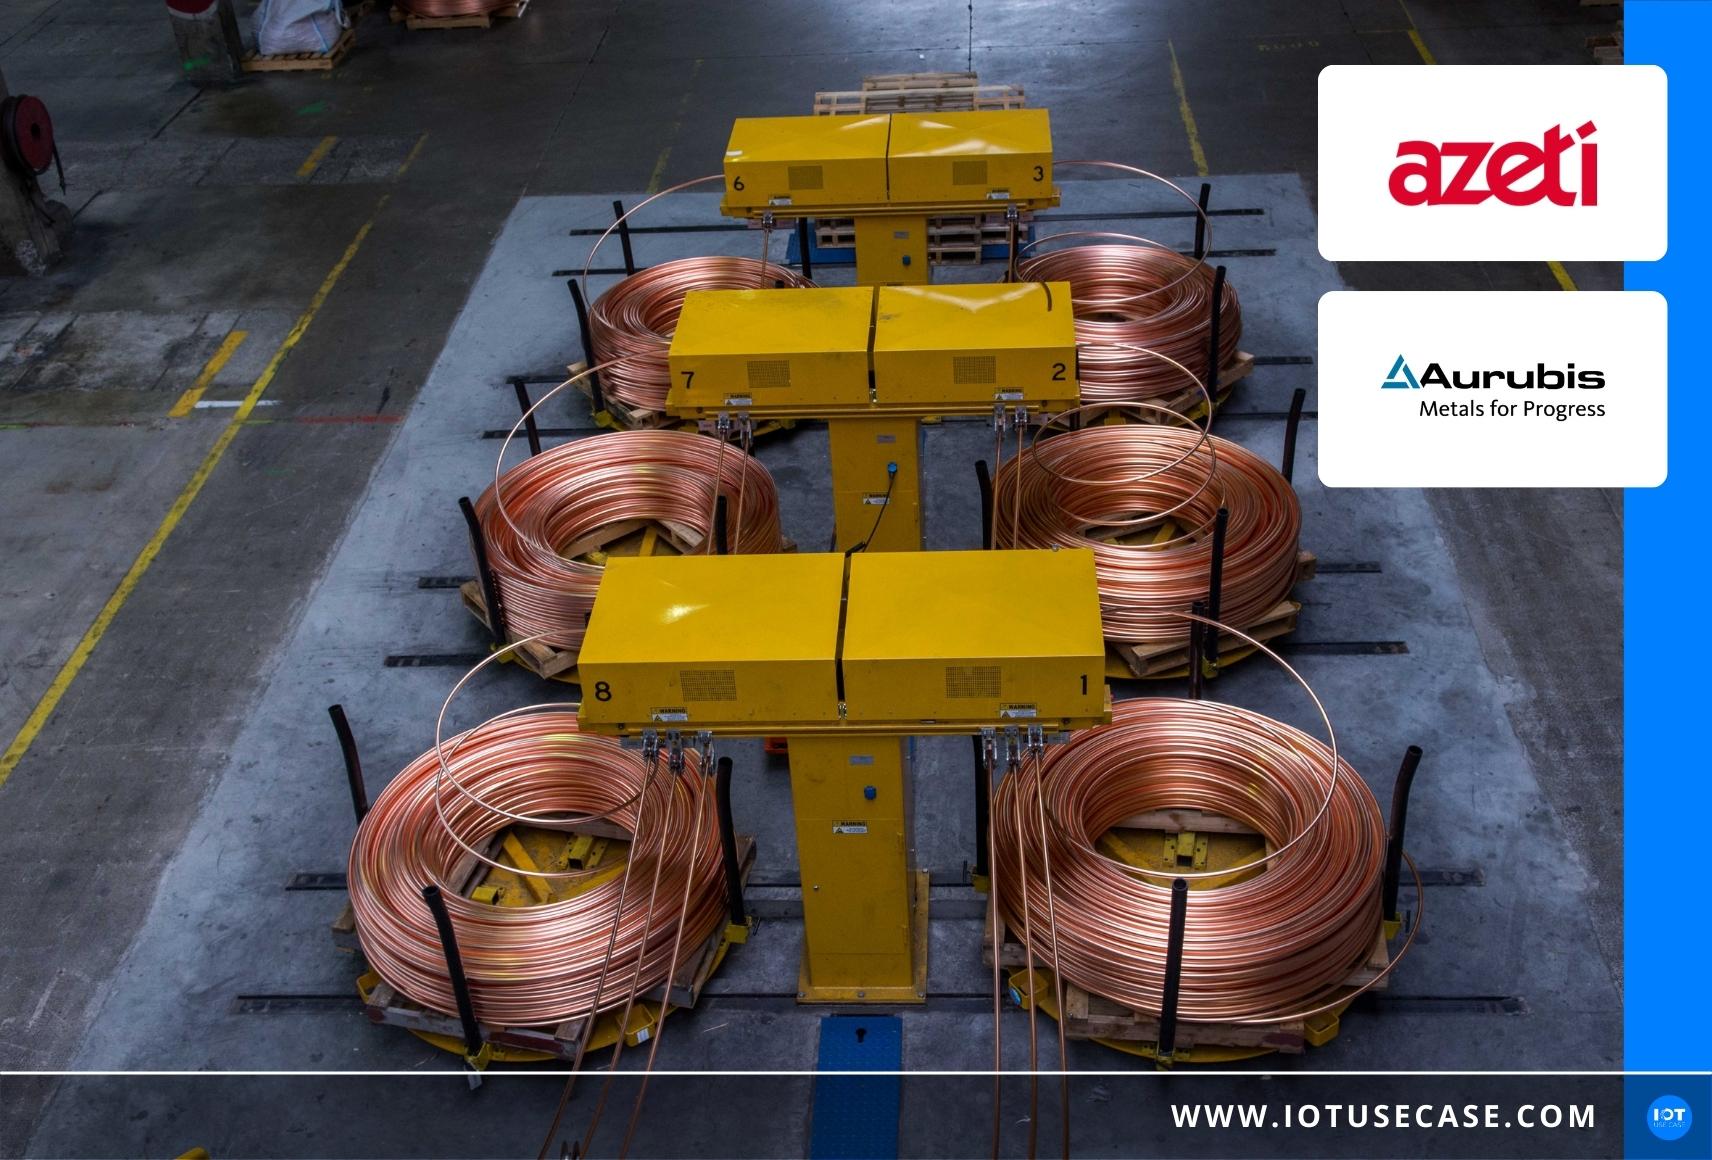
With this project, we want to keep closer track of some critical device parameters in a dashboard. One of these parameters is, for example, the temperature of the cooling water for the inductor. When the inductor insulation wears out, the temperature of the cooling water rises. By monitoring the data from this process over a period of time, we can predict production downtime. This dashboard helps us understand the condition of the core equipment.
Now today you already have various systems that allow, for example, monitoring and condition monitoring. In collaboration with azeti, what requirements were important for you to develop this IIoT solution?
Yanni
In fact, we monitor more than 1,500 different process parameters in our production facility. The goal of this project with azeti was to present the most important process data in a clear and understandable dashboard.
Florian, how did you approach the issue internally? What steps were necessary? You probably need all those stakeholders you mentioned at the table, right?
Florian
Yes, indeed. At the beginning of everything there is an agreement on a common understanding of the problem and a common goal. This includes an assessment of feasibility from both a technical and business perspective. Only when these criteria are met do we think about what data is actually relevant, where it is located, and how we can gain access to it. This usually depends on the physical interfaces and protocols already in place.
First of all, how do you get the data from manufacturing? After all, there are many machines in production.
Florian
Let’s start with a brief description of what a production environment usually looks like. Because normally it consists of many different machines, controls, sensors and other devices. Some of the machines are equipped with relatively new protocols and interfaces, while others still work with established protocols that date back to the 1980s.
In short, there are quite a few protocols and interfaces to deal with in order to be successful. Even though standardization is underway, such as the use of OPC UA in manufacturing, there is still work to be done to move from the many different standards that currently exist to a unified standard in the industry.
OPC UA is not always available, right? It is present in maybe 3 to 5% of the machines? It’s a fairly new standard.
Florian
Yeah, I mean, it’s catching on more and more in the industry. There are still protocols such as Modbus that is well established and works, but it is not a new protocol. It makes sense to cover a wide range of protocols.
Turning now to the actual data collection part, we start by figuring out which data points are really relevant to the use cases. Then we check if they are available and in which systems they are normally stored. This is because some data may be available in historian and control systems, for example, while other data is only available via retrofitted sensors.
The next step is to look at how these systems can be connected. In most cases, we can use protocol adapters that come with the azeti IoT platform. But in some cases, we have to offer a customized solution, such as implementing a completely new protocol or even retrofitting machines. This may be the case, for example, if you want to determine the condition of a machine based on vibration data.
A buzzword that has already been talked about: Historical data that already exists in these different systems. The IoT platform also works with this data, right?
Florian
I mean, in a production plant there are usually already various monitoring systems. Various systems that collect data from production. That is, to get the full picture, you need to connect to all systems. This includes historical data.
So, first of all, get the data. The next step would then be to evaluate these different data: How do you do that? What’s important for you to do here?
Florian
Once we know how to obtain the data, we also need to verify that the data actually passes the quality check. That is, are they consistent and granular enough over time? And do they arrive continuously? Some data turns out not to be as suitable for our use cases as we first thought. So that would mean we need to think about other ways to get the right data, and also consider retrofitting a machine with additional sensors to capture that data.
So you need a steady flow of data and do some kind of quality control on that data?
Florian
Right.
Yanni mentioned earlier the challenges and the data needed, such as the temperature of the cooling water, even pressure data, such examples. What kind of use cases have you realized here from a manufacturing perspective?
Florian
As Yanni mentioned, in this particular use case we’re talking about today, the azeti IoT platform is being used to provide insights into the core of production. For example, critical parameters such as electrical values or the temperature of the cooling water are displayed on a customized dashboard, on a time scale that can range from ten days to several years.
But it’s not just about visualization. It is also about the evaluation of the data. That is, the collected values are compared with threshold values. So, when a threshold is exceeded, an alarm is created and sent by email to those responsible for production.
This use case is a pretty good example of how we can show the current status of a production unit as well as its behavior over time. It also allows us to combine data from multiple sources into one dashboard, all of which are relevant to understanding in detail what is going on in production and getting the full picture. Having all the data from the various sources also allows you to overlay them and more easily identify correlations that could indicate a potential problem.
You talked about the dashboard and all the data that you see and the fact that events can be sent to different people. I would like to understand this a little better. For example, how and where are these dashboards physically available? Because not all employees have a cell phone with them at the production site – or do they? So where are the dashboards physically available to employees?
Florian
It pretty much depends on which dashboard you’re looking at. But usually they are all responsive. So they can be accessed via laptops, but also via tablets or even cell phones. And especially when people are using these dashboards – like maintenance staff who are always on the go. It’s very convenient for them to be able to access the dashboards at any point in the day, no matter where they are.
Yanni, how was it for you? Do you have your cell phone with you? Or where do you have your dashboards available?
Yanni
It is in fact an easily accessible online azeti platform. I can use it on my laptop, for example. But even if some process parameters exceed a critical value, an email is sent to my cell phone, and then I can easily connect to the platform via my cell phone.
Florian, you just mentioned your azeti IoT platform that you developed. Could you give us some insight into the products you offer here? You mentioned different types of solutions. What kind of products can I find in this azeti IoT platform?
Florian
As mentioned earlier, our main product is an IoT software platform. It is used to capture highly granular data from various shopfloor systems, such as machines, sensors and control systems. But capture is only ONE part. The other part is managing and integrating all the data and making it available in a standardized form so that it can be used by applications such as predictive maintenance advisors or machine health cockpits.
I mean, the whole process, from sourcing to managing to integrating that data and making it available to all applications, is quite complex. However, our customers don’t have to worry about this kind of complexity themselves, because our team can take care of almost everything for them. This means that in addition to the platform, we also offer the complete package, i.e. the software platform, but also services to install and operate the platform, in the customer’s environment, around the clock. That means they don’t even have to run it themselves: We can do it for them.
Our teams can also advise on the management and implementation of the project and implement the use cases. This can even range from connecting data sources to developing logic to creating dashboards for customers.
Who is actually developing here? Many customers have their own employees for this, some companies do not. Does Aurubis also have its own software people and employees who process this kind of data?
Florian
The software platform is developed entirely by azeti. But Aurubis has internal Data Science teams that develop machine learning algorithms. And, of course, they also have their own corporate IT, which, together with the OT department with its own digitalization unit and together with azeti’s consulting team, is responsible for implementing the use cases.
In the last chapter, I’d like to talk about the business case behind it, because people keep asking me what the business case is. What is the business case here? Yanni, maybe you can start with this – is it mainly about cost savings?
Yanni
As stated earlier, we can avoid unplanned maintenance stops and even perform predictive maintenance. We even improve safety by predicting wear on key plant components, which ultimately increases productivity.
Florian, is it the same for you too? Can you add something here?
Florian
Yes, absolutely. Basically, it’s about creating transparency about the production environment. And giving people the right information they need as early as possible. This allows them to plan efficiently and reduce risks that could negatively impact production. For example, if a malfunction, e.g. due to worn parts, is not detected early enough, it can result in lower productivity or even a loss of production. And then when a core process, such as melting, is compromised, it affects the entire production.
Through visibility, they can not only detect response time, but also optimize it and help avoid or reduce the risk of downtime that would otherwise incur significant costs and likely impact production performance.
Many companies today want to learn from best practices. Yanni, what did you learn in the process? Do you have some best practices you can share with our listeners?
Yanni
It is very important to collect and present the right data. With one look at the dashboard, you should already be able to get an idea of the condition of the equipment. Measuring data is one thing, but analyzing and learning what is normal and what is not is something else.
Yes, that’s what Florian just mentioned, that dashboard to bring the impact to the data for a good solution. Florian, we have different audiences that may or may not be from this industry. Perhaps they are struggling with similar challenges. I always try to transfer these use cases that we have discussed to others: How could we transfer this use case to other companies? Or what other projects are you working on right now?
Florian
In general, the challenges facing companies are quite similar. The key is to gain access to relevant data that helps create the necessary level of transparency and also generate insights. And that’s then the basis for acting on the data and also to enable data-driven decision making overall.
You have big projects anyway. For example, with the Norican Group, but also other companies that you work with.
In summary, I am very glad that you shared the information about this project.
