


The 66th episode of the IoT Use Case Podcast shows how Real Time Location in intralogistics – more precisely in whole-carton handling – increased efficiency in processes by 40%. From goods receipt to goods issue, productivity has been increased, process times reduced and order throughput times accelerated.
Episode 66 at a glance (and click):
- [06:44] Challenges, potentials and status quo – This is what the use case looks like in practice
- [12:25] Solutions, offerings and services – A look at the technologies used
- [29:57] Results, Business Models and Best Practices – How Success is Measured
- [31:41] Transferability, scaling and next steps – Here’s how you can use this use case
Podcast episode summary
This podcast episode is about an e-commerce logistics use case in smart warehousing. The challenge is the classic processes such as inbound, storage and outbound, which are very personnel-intensive. There are a lot of manual operations, such as sorting, searching, scanning and moving boxes to the different logistics zones. Incorrect bookings, packing errors and empty runs must be avoided in order to withstand the high cost pressure.
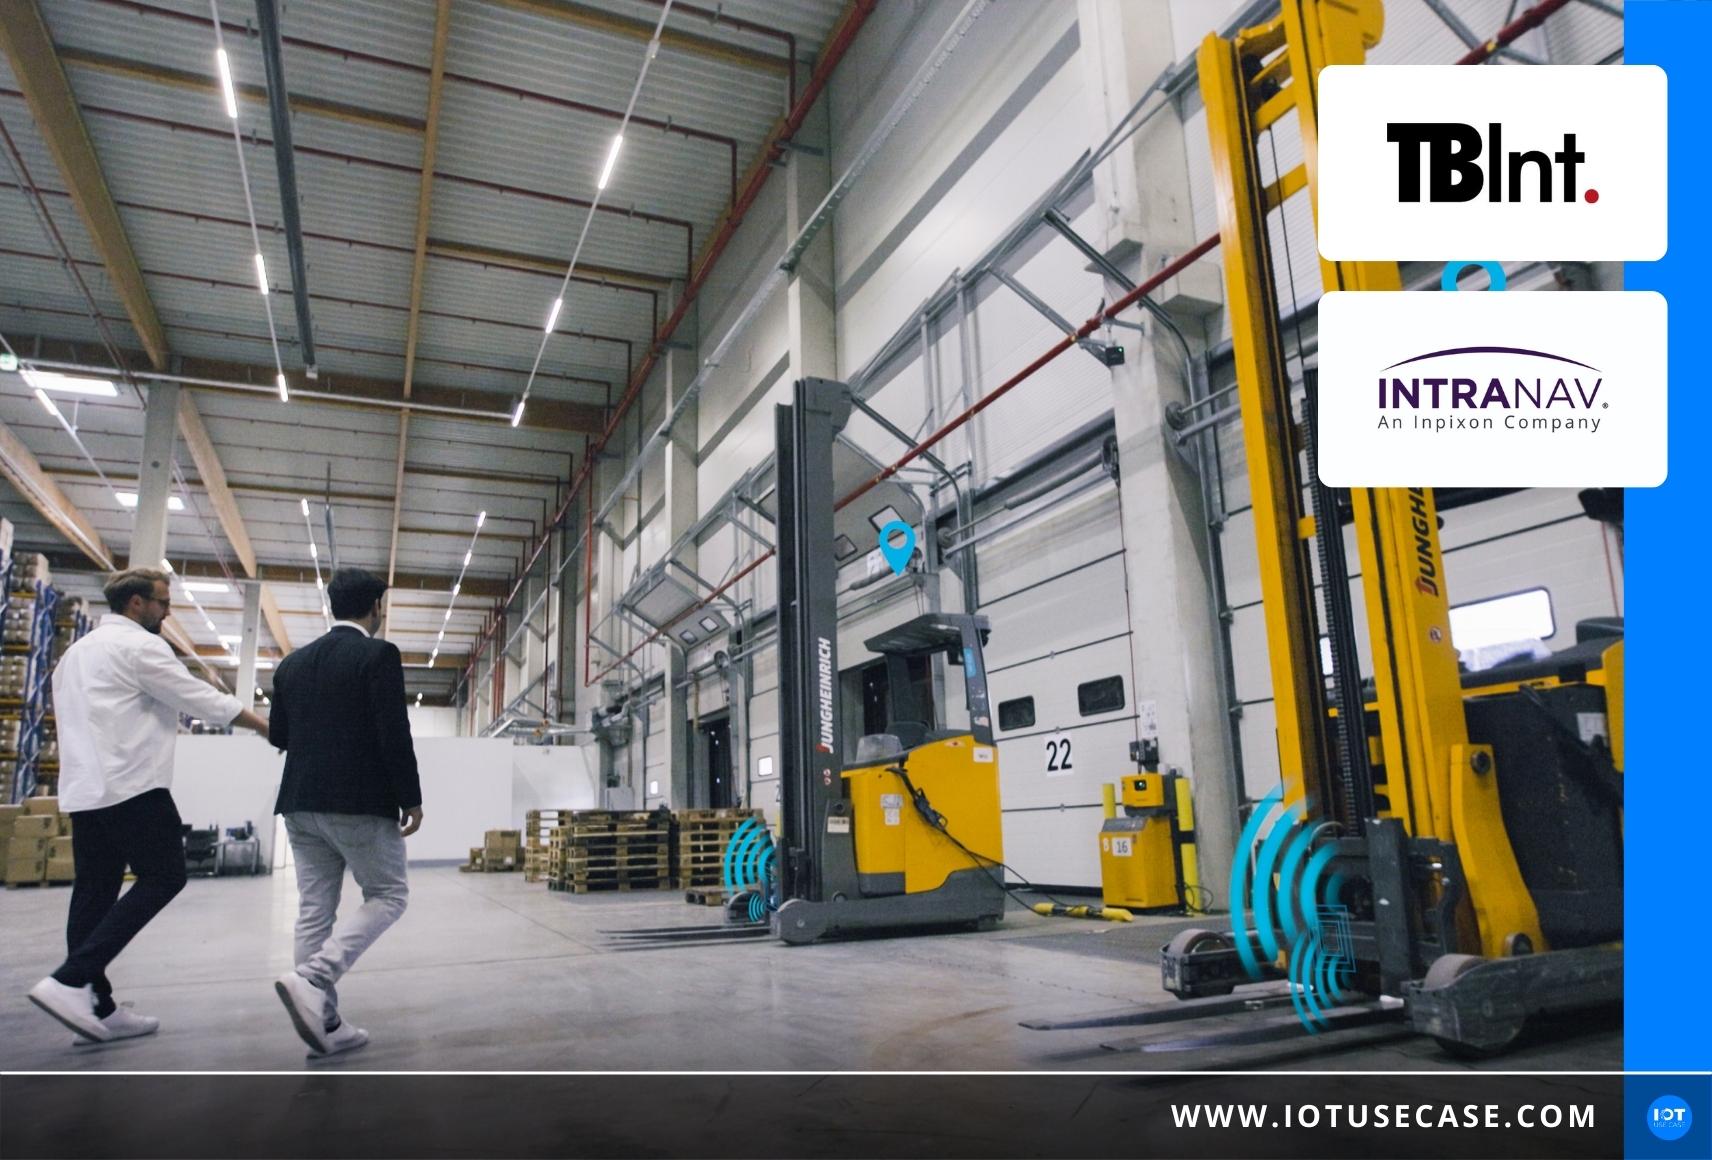
Textile wholesaler TB International is supported in these processes by INTRANAV. INTRANAV (an Inpixon company) is an expert in the field of industrial IoT real-time localization systems (RTLS), the location of a wide variety of objects via wireless technologies. TB International is one of the most successful textile wholesalers for major fashion brands, such as Urban Classics, and carries a total of 15 textile and accessory brands with approximately 15,000 retailers worldwide.
This podcast episode is about efficiency improvements in intralogistics, open sources, live data, heatmaps, RFID, human-technology interfaces, hybrid cloud, MQTT, SAP, WIREPAS, MESH, tags, BLE, UBB and much more.
Madeleine Mickeleit’s guests on this podcast episode:
- Ersan Guenes (Senior Vice President IIoT for Logistics & Manufacturing (DSC), INTRANAV).
- Johannes Rudenko (Managing Director Logistics & IT, TB International GmbH)
Podcast interview
Ersan, you are Senior Vice President IIoT for Logistics & Manufacturing at INTRANAV, part of Inpixon Company, and founder of the company itself. That’s why I’m so glad you’re here today to share your input.
Ersan
Thank you very much. The way you said that fits: Inpixon has acquired INTRANAV and together we are one plus one equals three.
With INTRANAV you are the expert for industrial IoT respectively IIoT real-time localization systems. Keyword RTLS. The bottom line is the determination of locations of various objects, or machines, equipment, via radio technology.
What I think is really cool about you guys is that you choose technology based on the business case. You are not limited, but open, as an open-source. You have your own apps that come with the fitting platform, and you can integrate that data in different ways. Can you put it that way?
Ersan
That is absolutely correct.
Johannes, you are Managing Director Logistics & IT at TB International. You are one of the most successful Wholesaler in textiles for major fashion brands, such as Urban Classics, and run a total of 15 textile and accessory brands with approximately 15,000 retailers worldwide.
Johannes
Thank you for the invitation, that is correctly said.
We always talk about a wide variety of real-world use cases so that we can really understand these different technologies in a simple way. Ersan, what use cases have you brought with you today and what project are we looking at in detail today?
Ersan
We brought Smart Warehousing, which we are currently offering for the e-commerce logistics use case. Here we deal with the typical processes such as inbound, storage and outbound. This means that the goods arrive in the warehouse, are identified there, put into storage, or sorted beforehand, and then removed from storage, picked, packed and transported to the shipping warehouse in the subsequent process. These are the use cases that we map, so practically this end-to-end warehouse.
What project exactly are we talking about today?
Ersan
This is about the automation we have implemented at TB International in Groß-Gerau, where we have equipped the warehouse with a system that makes it easier to identify the goods at goods receipt – i.e. inbound. As well as a system that can tell how to sort the goods based on the data and check if that was sorted correctly. And, accordingly, the storage. The system tells exactly how the goods have to be stored and where. This work is extracted from the human and mapped systemically.
Johannes, you have been working on the topic of digitization for several years. What is your vision with the topic or also with the topic IoT? Where are you going with the logistics anyway?
Johannes
At TB International, we are massively driving forward the automation and digitalization of our value chain and invest several million euros annually. Automation and digitization are an important pillar of our corporate strategy. For us, this means optimizing individual business processes in a more transparent, adaptable, networked, and efficient manner, and performing the process flow more quickly, especially in logistics. For example, we work with ML6, a machine learning specialist. We collect and analyze data along our value chain to better understand our customers’ needs and trends, so we can then produce the right products in the right quantities and deliver the clothes on time. In our textile printing plants in Europe, we use state-of-the-art digital and textile printing machines, including automated value-added service processes. In intralogistics, we have an automatic small parts warehouse for certain process steps and workflows, for example, where individual parts are handled, including the connection of a bag sorter, in order to supply our B2B and B2C customers quickly and within 24 hours. In 2020, we began working with Ersan and INTRANAV to look at the business process of whole-carton handling in the Replenishment area in order to generate an increase in efficiency here as well.
Challenges, potentials and status quo - This is what the use case looks like in practice [06:44]
It’s all about intralogistics and small parts storage, especially whole carton handling. Can you tell us what your day job looks like? Maybe one or the other listener comes from the field, but maybe just to understand how you guys handle a customer order.
Ersan
You can imagine it like this: For example, we are in a replenishment warehouse in whole carton processing, a large warehouse with 25,000 square meters of logistics space and almost 35,000 pallet spaces. Between 15-, 20-, 40-foot containers from Asia are delivered here daily. The goods must then be unloaded and stored via a forklift. This is the inbound process. The outbound process begins with the generation of the customer order. The goods are picked, packed and then delivered to the end customer via a CEP service provider or a freight forwarder.
That means your customer, for example Urban Classics, commissions you in the area of textile printing, and this order is then processed completely by you, so to speak? From the goods you order to your own production, to picking and packing, right?
Ersan
Correct.
You have concrete goals, also in the direction of digitization. It’s usually like this, you start with a business case, you really want to leverage business potential. What are the challenges that you have seen in everyday life, or the potential that you have seen in the individual initiatives and use cases?
Ersan
A very classic challenge is the cost pressure in logistics. If you look at today’s job market, even in logistics, it’s very difficult. Finding good forklift drivers is currently a huge challenge. Our processes in whole carton handling in particular are very personnel-intensive. We have a lot of manual operations for sorting, searching, scanning and moving boxes in the different logistics zones. Both inbound and outbound of the warehouse. Forklift operators often don’t immediately know where available transport orders are nearby, as an example. Empty runs occur, which in turn cost time, and now and then there are mispostings and packing errors, which are very annoying and result in rework. These are all challenges and potentials that we wanted to leverage with this project.
Many are technically inclined and interested in the data and a few insights. Can you tell us what data is particularly exciting for you guys in each process? Perhaps a few examples to help you visualize this.
Ersan
Let’s start globally, at the front of the chain. Directly the data we generate in the production facilities in Asia. For example, what orders have been produced; how and when have orders been loaded into the container? Then along the value chain, quite interesting also the GPS data of the containers. Are there bottlenecks at the ports? What is the status of the containers; have they been loaded onto the ships or not? Especially in the current situation where there is a lot of chaos in SCM, this information is very valuable to be able to proactively inform our customers as well, so that we can say, look, there is a problem here, we are expecting a delay here, so you already know. Tracking by sea and handling at the port of arrival and the precise notification of the containers to our logistics locations. Globally, these data are the ones we are interested in. If you look at intralogistics, this is live data, for example the location of unnecessary driving and material flows, which we can evaluate directly via a heat map in order to avoid waste and generate an increase in efficiency.
With the heat map, what are you measuring?
Ersan
For example, the travel path of a forklift.
I have heard issues from other logistics companies in our community where in some cases forklift drivers have to go around objects or where something is placed where it is not supposed to be. Situations that just happen, where you can save time, where there is insane potential. You implemented this project together, and to take a step back: What were your requirements from the beginning? You have a lot of different data, both in inbound and picking, or in intralogistics itself. What were requirements for the system, what was important to you, or the demands on INTRANAV.
Johannes
The first step was clearly to find the right solution for our intralogistics challenge. In the second step, find a good partner or provider with whom we work in partnership. When we tackle projects, we want them to be sustainable. The whole thing in an agile approach, developing quickly and directly generating added value for the organization, that is extremely important to us. We are in very good hands with Ersan and his team. We designed a target image on a white sheet of paper in a very short time, and after six months we completed the first tests on the field. This worked pretty well and in a really short time frame. We are very satisfied with the cooperation.
Solutions, offerings and services - A look at the technologies used [12:25]
The bottom line is, Ersan, you created a virtual warehouse solution – I don’t know if those are then IoT apps from your INTRANAV platform that you then built. When you tackle such a huge project, with a wide variety of initiatives, what was important to you at the start of such a project, and what should you pay attention to above all when tackling something like this?
Ersan
As Johannes also said, it’s very important that we in the team – by that I don’t just mean me, but also those who are working on it – have understood the actual customer pain points, so that we all move forward more or less aligned in one direction. Because that has an impact, especially in things that have never been done that way before. That the architecture fits, and you don’t find out later that everything has to be changed again. That’s a no-go at the rate we’ve been doing it. It was therefore very important that we talked intensively with Johannes and also his team in several workshops, where the topics were then discussed, for example: What does the IT architecture look like? Are our functions programmed directly into the SAP target system or is there an intermediate level – it then turned out, yes there is.
The colleagues, our counterpart at Johannes, it really worked out wonderfully what we thought about and coordinated the interfaces and implemented it in a really scalable way. In the process, it became clear what the target architecture for this first pilot, i.e. the first use case, must look like in the end and how it can and will look scalable. It was very important to understand that we are not just operating in the cloud there and shuffle data around from SAP. But that we have hardware on-ground, so an RFID reader. It has the challenge of having to send the data. You have to take into account that this can’t always work out.
A very specific problem: We had set up a WLAN bridge – and in a warehouse like this, when people are not aware of what is going on, a black box like this is pulled out of the socket so that you can quickly charge a smartphone. On the other hand, the entire system just breaks down and the warehouse no longer recognizes the cartons. These are little things that have come up in the testing stage that are then noted; and we realize when we’re productive, we’re not going to plug anything into a normal outlet, but we’re going to make sure that the data transfer is productively usable.
Then it goes on: How do people work with the system? An external container crew is deployed there to unload the packages from the container and scan them via our system. Accordingly, these people must be trained to suddenly work with an IT system. The issues, this little change, it has to be done properly and cleanly. Acceptance must be generated. The UI may not be what a fellow developer envisions in an app. But perhaps completely different elements need to be brought to the fore and the data visualized. So it’s also important to understand what data context is important for the people who end up working with the system?
I’ll make it a bit vivid: With the navigation system, we’re used to there being the route and a red arrow. In the forklift case – you can imagine someone who has never worked in logistics before, maybe the forklift driver needs some kind of mini nav with an arrow … but that’s wrong thinking. People know their warehouse so well, they only need to have the warehouse number displayed in large letters, then they already know how to get there in the best possible way. The important thing then is the sequence, which we then look at in the route optimization aspect. That’s why we need the location data, because we need to know where you are so that you can drive through optimized.
In the more complex RFID issue, the boxes have barcodes, they are applied in China or at a partner abroad. That’s where it’s important to understand, how is it applied? How is the data generated in the first place? All of this then has to be included somewhere in a joint document, which is then also discussed later with the suppliers, so that the right thing is done there.
Johannes
As addition to change management: Training warehouse employees in the handling and use of such technologies is an extremely important and crucial point at this point. There is often a certain inhibition towards such technologies. That’s why you have to take the employees by the hand and explain it to them in several runs. This is the only way to ensure that the technology is accepted in the long term. Then there is also the set requirement for a logistics manager in such a warehouse. It also changes greatly. Suddenly, in addition to leadership skills and business aspects, you also need basic IT skills. You have to have certain analytical skills in order to derive the right measures from acquired data. Generally with the implementation of such technology comes extreme challenges. For jobs in the future, this means that they will become more complex. It’s very exciting, the whole thing.
Rises and falls with the employees at the end, who, as you say, suddenly make data-based decisions, which of course brings new requirements. While we’re on the subject of explaining this system, you have to talk a lot about it… You’ve taken this IT architecture and also looked closely at the interfaces. I would now like to understand how the whole thing works from data acquisition to processing to analysis. Can you describe this IT architecture roughly so that you can then go into more depth?
Ersan
We started as a company dealing exclusively with industrial customers. The industrial customer seven, eight years ago would have never accepted the cloud. Meanwhile, a giant like Siemens Energy, it’s pulling off its cloud strategy. They have recognized the added value and advantages and are implementing them accordingly. Kudos to Siemens Energy, but that’s not always how the midmarket works. That is why it is very important to present a solution. Some call this hybrid cloud. So you have a computing unit somewhere on site that stores and processes the data. Maybe there are just certain results being delivered up there, to the cloud. Here in Johannes’ case, it is the case that the company TB International has a very good cloud strategy. Accordingly, the SAP system is in the cloud. We still have the challenge that we need real-time data in the warehouse and we need some resilience. That is, what happens when the Internet goes down? That’s a disaster scenario, but has become synonymous with, what if the power goes out? That’s where it’s important that by having or avoiding some latency, we have an edge computing unit on site to take care of collecting that IoT data. This is then, for example, the location data, i.e. the ultra-wide-band positioning data of the forklift. There’s a little device on there that tells us very precisely where this forklift is. It makes a difference whether we get that in two seconds or in three minutes, because in three minutes he can be somewhere else entirely. This edge unit sends data to our cloud peer via a message bus, which is MQTT. This is a secure channel. There, via a REST API, are the interfaces to our API that leads to SAP. So we took this hybrid cloud-based approach. This whole software architecture is dockerized by us, that’s the advantage. If someone is faced with this challenge of implementing an IoT system to this extent, dockers can be used beautifully to create a simulator environment at their office that simplifies the day-to-day testing. We can create a digital image of this warehouse, so to speak, test that, and can look to deploy that accordingly. What is now a small special feature, this architecture: We looked a bit at the Big Data colleagues, who still have a so-called Apache Kafka cluster. Why we need this is for the reason that actually the forklift and the other participants generate so much data. – If Johannes wants to generate a heat map that maps the traffic situation in the warehouse … this is such a flood of data that a normal system can no longer map it in a normal time, which is why this backbone based on the Big Data architecture has already been implemented, and as a result such heat maps can be generated relatively quickly, in seconds.
It’s about specific data that is recorded; RFID readers, so also tags that are involved in the different hardware devices. This can be a forklift driver or a product. How does the data acquisition from RFID or container data work?
Ersan
It is our hobbyhorse to include a wide variety of data sources in the subject area, be it RFID, Bluetooth, Wi-Fi or GPS. What we do is, we’ve created a standard situation level where we send in this data. Now let’s start with the container. For example, the container has a GPS tracker, that sends the data to our integration for that container GPS data and stores it in a JSON format with us on the platform, so you get that available in the database. With RFID, it’s like the RFID labels contain an ID that gives us the box information, which we can then also query in SAP. Then we get the data, what is in it. Whether it’s a hundred pieces or ten pieces. This in turn captures an RFID reader from a well-known manufacturer. This data is sent to a gateway via an industrial BUS, in this case Industrial Ethernet. This gateway then in turn sends to our INTRANAV IO platforms this data, just like the GPS container sends to an integration module, and we get standardized data formats in the back again. Why are we doing this? Because in the future we actually want the ambitious customer or partner to be able to do it themselves. Build applications themselves. Actually because we ourselves always work in such a way that we are app developers for our own platform, so a partner can also develop apps for our platform. That’s why it’s important to have standard interfaces. With ultra-wideband, it’s exactly the same: We receive the data from the forklift via an ultra-wideband system, then get it standardized again to our interface, where we can then aggregate the data accordingly in our apps.
How do you manage to transmit this data in real time?
Ersan
At one point, we made a point of using protocols that have a low overhead. You have to think of it this way, if I’m on the phone with my mother now and I have a protocol that has a high overhead, I would speak very formally, “Good afternoon Mrs. Mother, how are you? May I come to dinner tonight?” Or one with low overhead, “Mom, what’s for dinner, I’ll be there at 6:00?”. The same thing exists in technology. If you use the latter, you have less talk time, but longer latencies. Accordingly, we have also implemented this in the platform. In concrete terms, this means that Google has a protobuf-based protocol that you can google. It has a very low overhead, which allows us to achieve these real times of milliseconds.
You mentioned a wide variety of interfaces, and different data sources come together in the architecture as well. You can almost talk about a data chaos, where completely different systems that already exist have to be integrated somewhere. The next step is to make this data available in individual systems. How can you structure this data so that it can be integrated into other systems?
Ersan
This is a very important point, because we have to look that these data that we pick up are processed according to the priorities. For example, updates, that is, the forklift is loading something into a warehouse shelf, and it is very important for Johannes and TB International to know immediately that these goods are on the shelf, because that is then immediately available in the store from an accounting point of view.
Johannes
Again from the field, we have a data mining tool behind it via an interface. That’s where the data really comes in up to date, and then it’s visualized via a Power BI dashboard and displayed at our control center, in logistics.
Ersan
Data visualized there, for example, show the status of the warehouse, the order behavior. That’s why it’s important that we can deliver data to these interfaces quickly. There is also data that is not so important. Accordingly, we have built a data management system that makes this data available in the database and on the API according to these criteria. There are also customers who have forklift safety as a use case. This means that if two forklifts come too close to each other, an alarm must take place. Of course, that has completely different requirements, but even there the priority is very high and accordingly this data that is processed is staggered and made available on the API. We store the data on the hard disk. If a data lake is to be connected in the next step, the data is already prepared in such a way that it can flow into a data lake. This is a trend that is becoming more and more apparent. At TB International, this has already been put into practice.
Johannes, you also mentioned the heat maps earlier, around the drivers. You want to do a live locating of this data now. Ersan, how does this data analysis work? So I kind of need to know where are the drivers, where are they going, where are the potentials then as well? How do you do it?
Ersan
We have a so-called RTLS system. This stands for Real-time Locating System. And we have two products in our portfolio, one is a laser scanner, a so-called lidar, which is also used in autonomous driving, with which the forklift can locate itself. He then always knows exactly where he is. The disadvantage of the technology is that it is very expensive. For the use case at TB International, we deliberately chose an ultra-wideband-based system. That is, like WLAN, I have access points, and depending on the signal time … the forklift sends something out, similar to GPS, several participants then receive the signal and can then track down the position based on the time it took for this signal to be received. Trilateration. We need this data to map use cases where location information is important in a warehouse. Why can’t you use GPS on the forklift truck? Because the metal roof shields the signal, that’s why there’s no indoor GPS, you need these indoor GPS systems. The heat map reflects the standing time and location based on colors. If somewhere on this heat map – you know it from soccer – something is marked green, then it means, okay, at this place the action was only for a short time, and as soon as it turns yellow or red, there the forklift was now standing for quite a long time. When is this relevant? For example, if forklifts stop very often at intersections: that means something is wrong with the traffic. Or if you introduce AGVs, automated vehicles without drivers, it is also relevant for our customers to know how the AGV behaves. Because more and more, AGVs will have the right of way and forklifts will have different traffic rules. Therefore, one would like to know how is the material flow, how does my material flow, how long does it stand? These heat maps are one of the relevant data providers. What other great things can you do? You can make spaghetti diagrams. Back then, in my internship at a consulting firm, I always had to hold a stopwatch in my hand and look, where were the participants? Then I had to draw those lines myself – our system practically throws that out by button.
Johannes, how does this work in practice for you? What is important to you
Johannes
This works wonderfully in practice. We actually have access to the INTRANAV platform via the Power BI display or directly and can analyze the routes via live data and see where there is waste? Then the logistics manager can take direct action to eliminate waste and make the process leaner.
Results, Business Models and Best Practices - How Success is Measured [29:57]
You said this is a web-based platform that runs the whole thing. Are you also thinking of offering such solutions in a scalable or standardized way? Do you think in that direction, such heatmaps, spaghetti diagrams or use cases are somewhere transferable to other things, like the App Store?
Ersan
This is a very important issue. It is on the roadmap and will be announced soon. We want to make this INTRALYTICS available as a SaaS app for other users and interested parties. Then there is the option of either uploading data yourself and analyzing it or using your own hardware to collect the data and process it there. We want to offer a product that can be used continuously, especially for lean management activities and waste analyses. Maybe even offer tasks in Continuous Improvement, if you have that as an initiative in digitization, also as a good tool. It is therefore important to talk and work directly with the customer and then map the functions that are relevant there.
That means that if I already have my architecture for it now, I can also obtain an app through you, so to speak, which has already solved one or two problems. In that case, it also solves my problem, which means I can then download the app or obtain it through you. Or I start like TB International and work with you holistically and develop the whole thing.
Transferability, Scaling, and Next Steps - Here's how you can use this use case. [31:41]
Johannes, have you done the math on the business case for yourself that you can share with us? Maybe you have some insights for us?
Johannes
It is a huge investment for our company. Behind an investment, one must always make a return-on-investment calculation. If it doesn’t add value, then it’s not worth putting money into it. Specifically, we were able to generate an increase in efficiency of almost 40 percent through the RFID implementation in whole-carton handling. If you look at the entire process, from goods receipt to goods issue, we have increased productivity, reduced process times and accelerated throughput times of orders. We definitely got added value from this project.
In closing, do you have any learnings to share with listeners? Things you absolutely have to pay attention to, or things that took a lot of time?
Johannes
A tip, just do it! A piece of paper, a pen in your hand, on a white sheet of paper just sketch out your waste and your process and identify from that, what’s going well, what’s going poorly? What can be improved? Then, with INTRANAV, especially in the area of warehousing, there are opportunities to identify and eliminate waste.